Progression of solar cycle 25
Sunspot numbers including predictions
Clicking on the plot opens an interactive version.
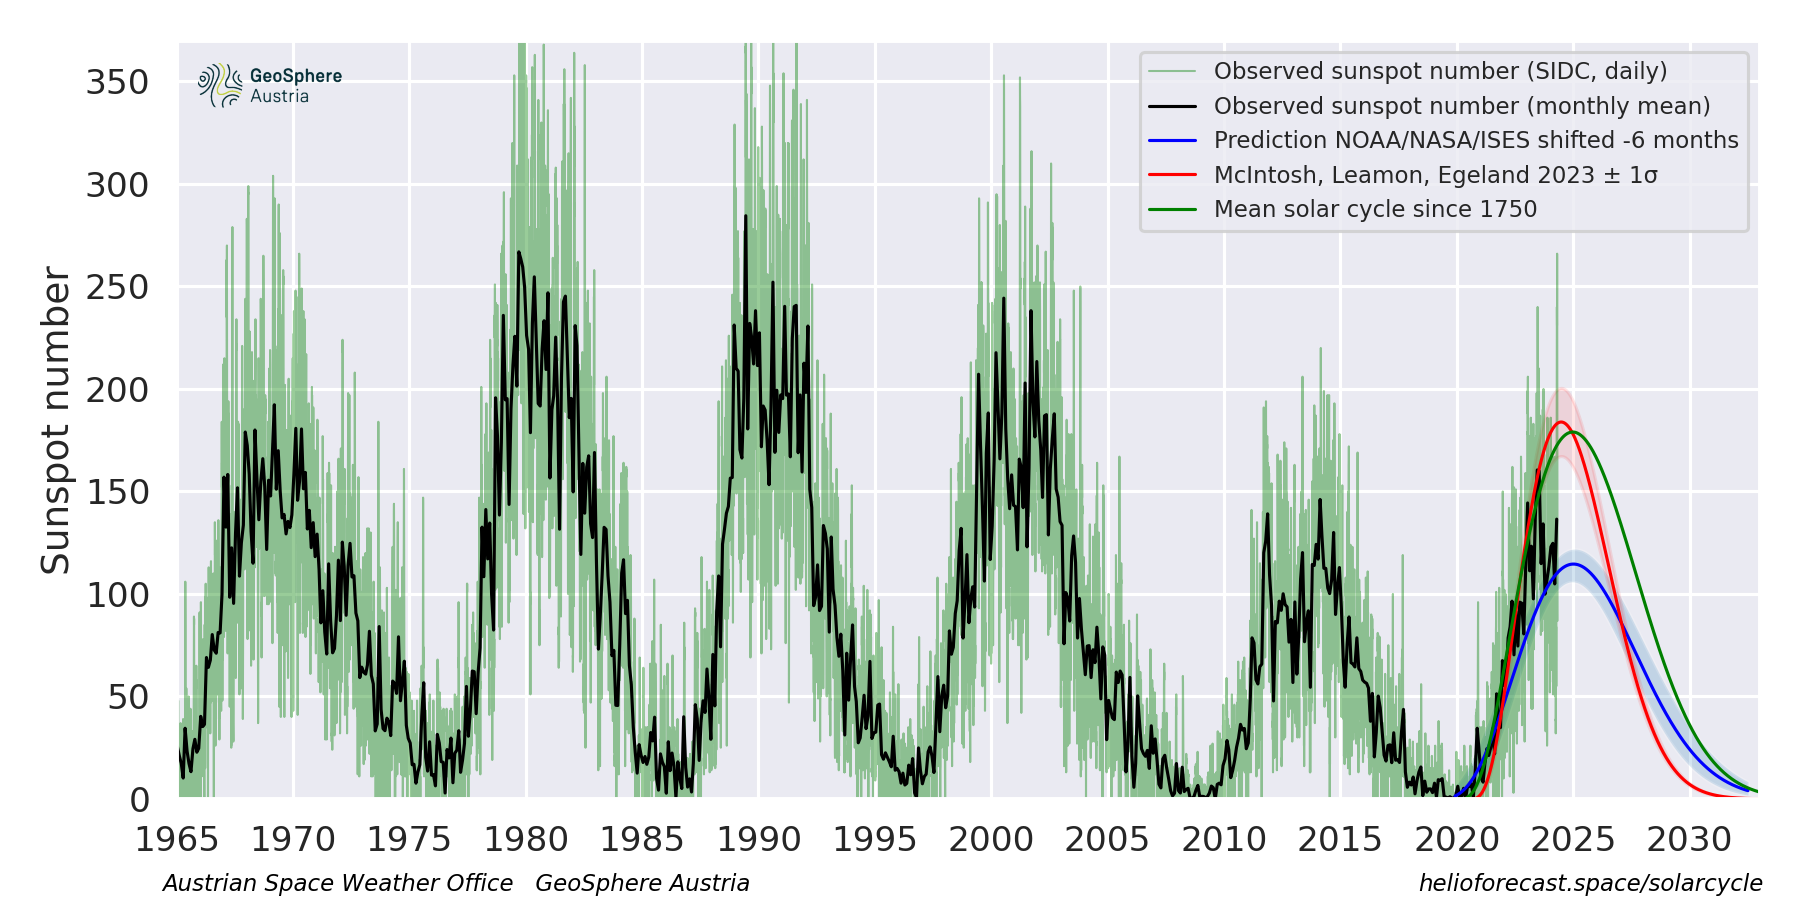
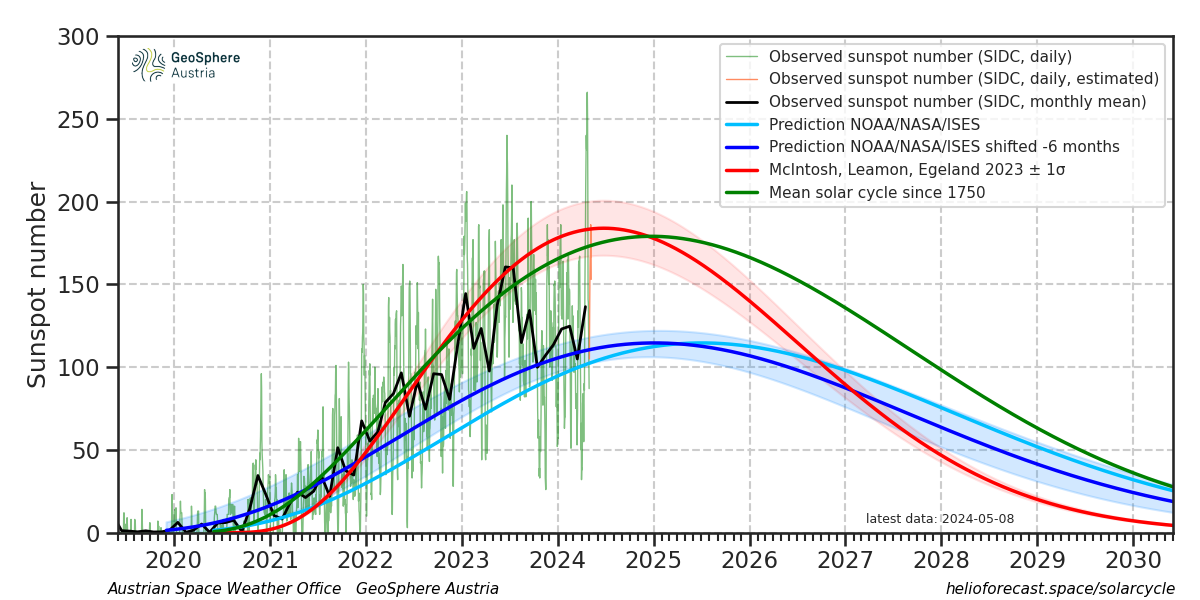
We plot here, daily updated, the predictions for the sunspot numbers for solar cycle 25, by the
NOAA/NASA/ISES panel (from 2019)
and from a prediction based on the timing of the so-called terminator event (McIntosh et al. 2020).
In early 2023, this prediction has been revised (McIntosh, Leamon, Egeland 2023)
to a maximum sunspot number of 184 ± 17 SSN, peaking already in 2024, indicated in the plots above as the McIntosh, Leamon, Egeland 2023 forecast (red curve). This is still quite close to an average solar cycle (green curve).
Solar cycle 25 behaves clearly stronger than cycle 24, but its intensity is still mostly below an average cycle since 1750. For example, Feynman and Ruzmaikin (2014) show that the weak solar cycle 24 is consistent with a minimum of a 90-100 year cycle on top of the usual 11 year cycle (the Centennial Gleissberg Cycle, CGC). This could mean that future solar cycles in the upcoming decades may be stronger than cycles 24 and 25, if the CGC approaches another maximum.
The source code to produce these plots is available.
The sunspot data are taken from the source: WDC-SILSO, Royal Observatory of Belgium, Brussels.
Note that in the two plots above, the official NOAA/NASA/ISES prediction is time shifted by minus 6 months to produce a match between observations and predictions, as the observed
sunspot number is clearly above the original NOAA/NASA/ISES prediction. The original non time-shifted prediction is plotted in lightblue in the second plot. For comparison, NASA Marshall Space Flight Center presents their forecasts for solar cycle 25.
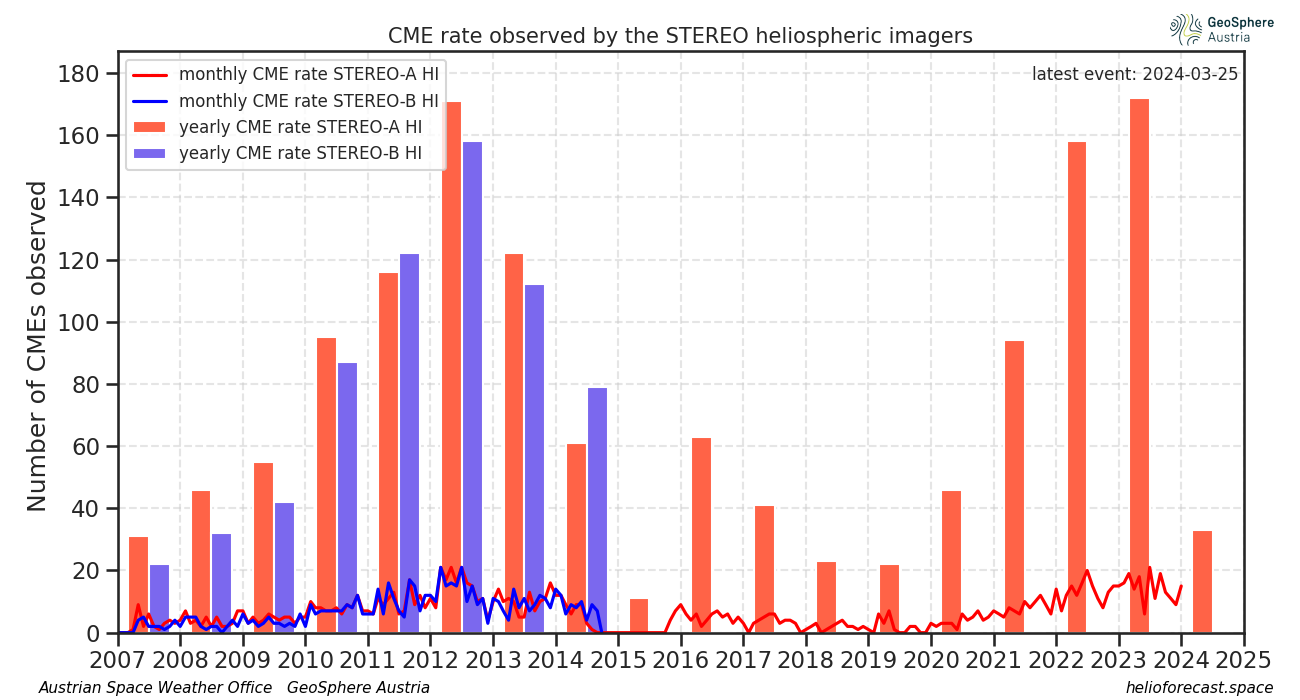
Coronal mass ejection rate observed by the STEREO heliospheric imagers
The STEREO HI instruments observe CMEs in the heliosphere since 2007. The monthly and yearly CME rate observed by HI is plotted here, based on the HELCATS HIGeoCat catalog, maintained by Rutherford Appleton Laboratory in the UK. Further info is available on the RAL STEREO HI homepage.
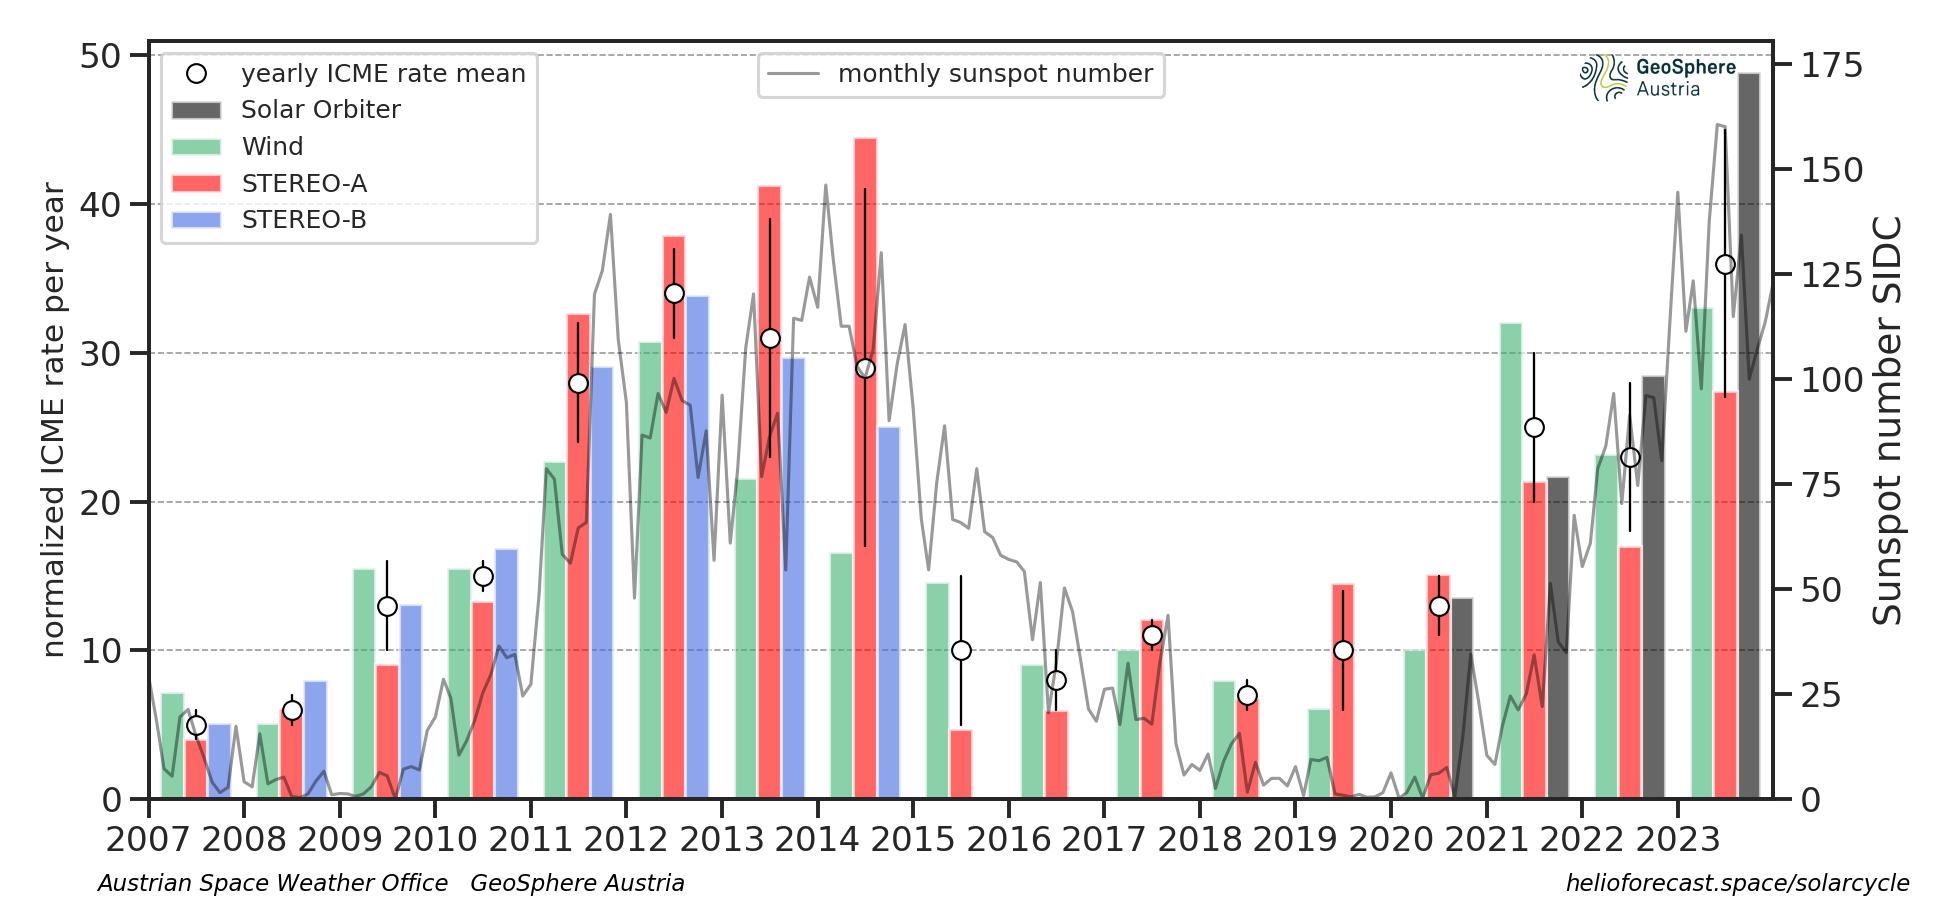
Interplanetary coronal mass ejection (ICME) rate observed by spacecraft in situ in the solar wind
We show the yearly number of impacts of ICMEs at spacecraft in the solar wind, for solar cycles 24 and 25, based on our ICMECAT catalog. Data from the four spacecraft Solar Orbiter, Wind, STEREO-A and STEREO-B are used, because they have an almost continuous in situ coverage of the solar wind.
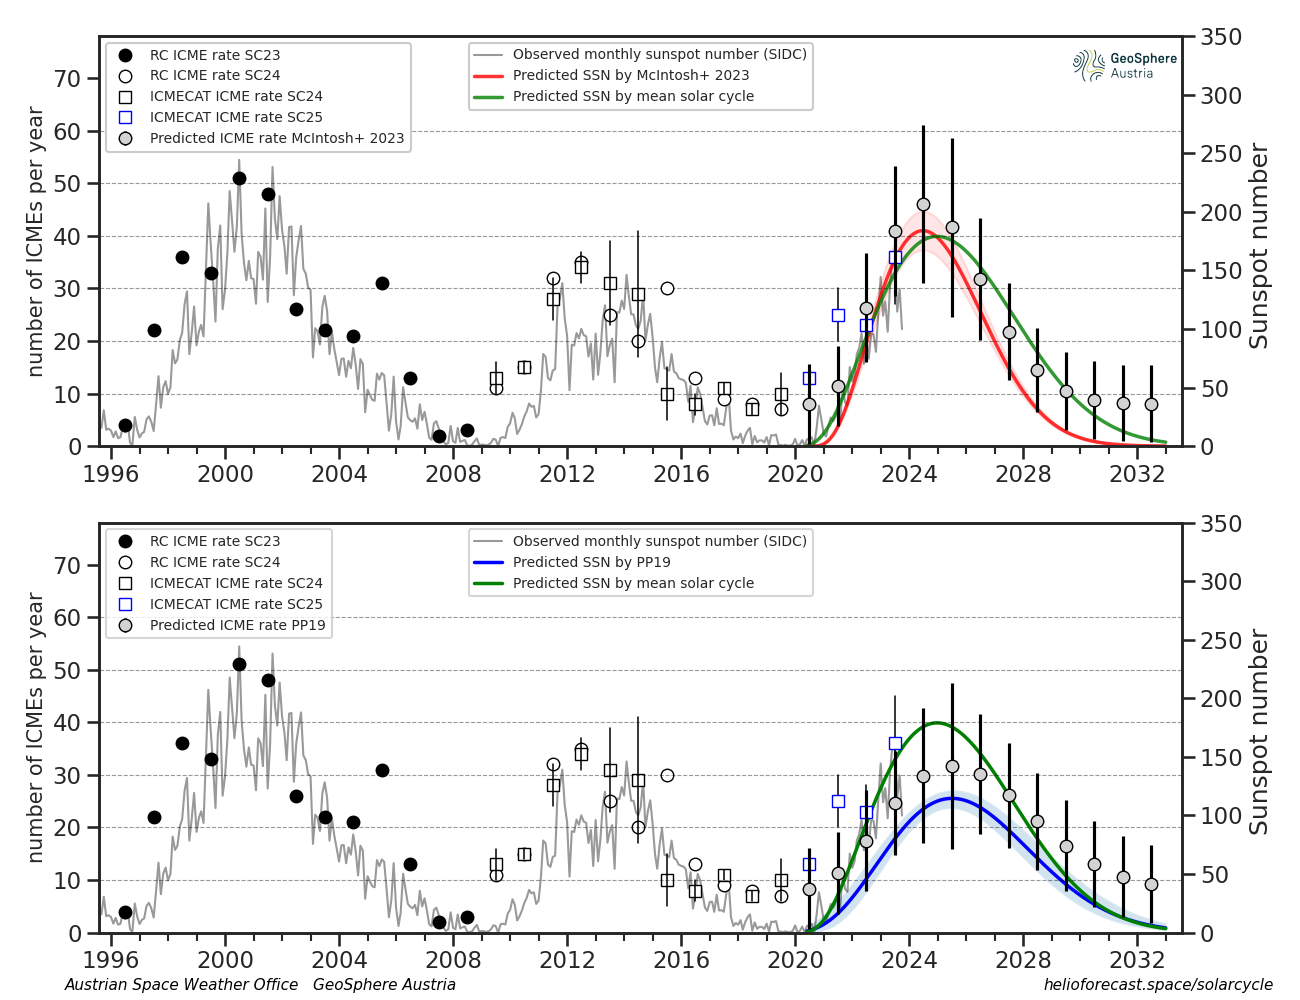
Prediction of the ICME rate for solar cycle 25
We have made predictions for the yearly rates of observed interplanetary CMEs in solar cycle 25. Originally, these were shown in Möstl et al. (2020, ApJ). This paper demonstrates how to get estimates of the ICME rate based on sunspot numbers. The plots below are updated including the observed ICME rates in 2022. The upper panel shows the ICME rate forecast (grey dots with error bars) based on the McIntosh, Leamon and Egeland (2023) sunspot number, and the lower plot the prediction from the NOAA/NASA/ISES panel in 2019.
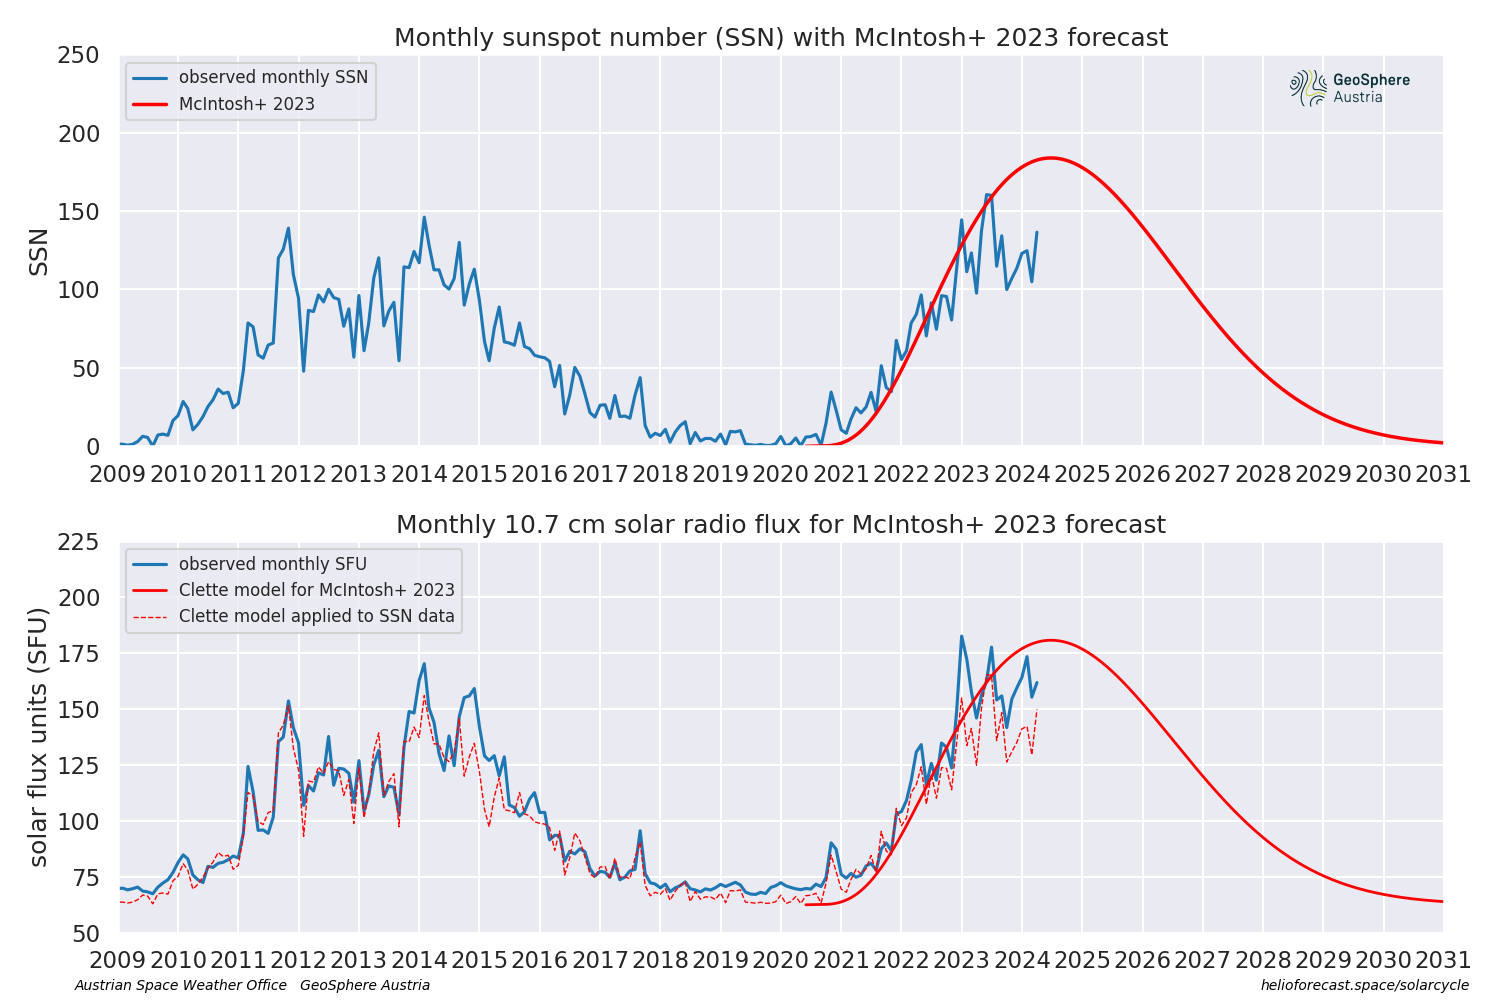
Prediction of the 10.7cm solar radio flux
Here we plot a prediction for the 10.7cm radio flux, which is known to track solar activity very well, using the McIntosh, Leamon, Egeland (2023) sunspot number forecast for solar cycle 25. The current data are provided by NOAA. To calculate the radio flux from the predicted sunspot numbers, we use Equation (2) with a 2nd order polynomial in Clette (2021). Based on this prediction, a averaged maximum SFU value of 180 is expected to be reached during solar maximum in 2024. The code to produce this plot is available here. Confidence ranges need to be added in the future.
Clicking on the plot opens an interactive version.