Coronal mass ejection southward Bz magnetic fields
This page will be dedicated to forecasts of the southward pointing Bz fields in solar coronal mass ejections (CMEs). We plan to demonstrate here real-time models and charts for forecasting the geomagnetic storm strength. Initially, we present some statistics that should already be useful for real-time CME forecasts.
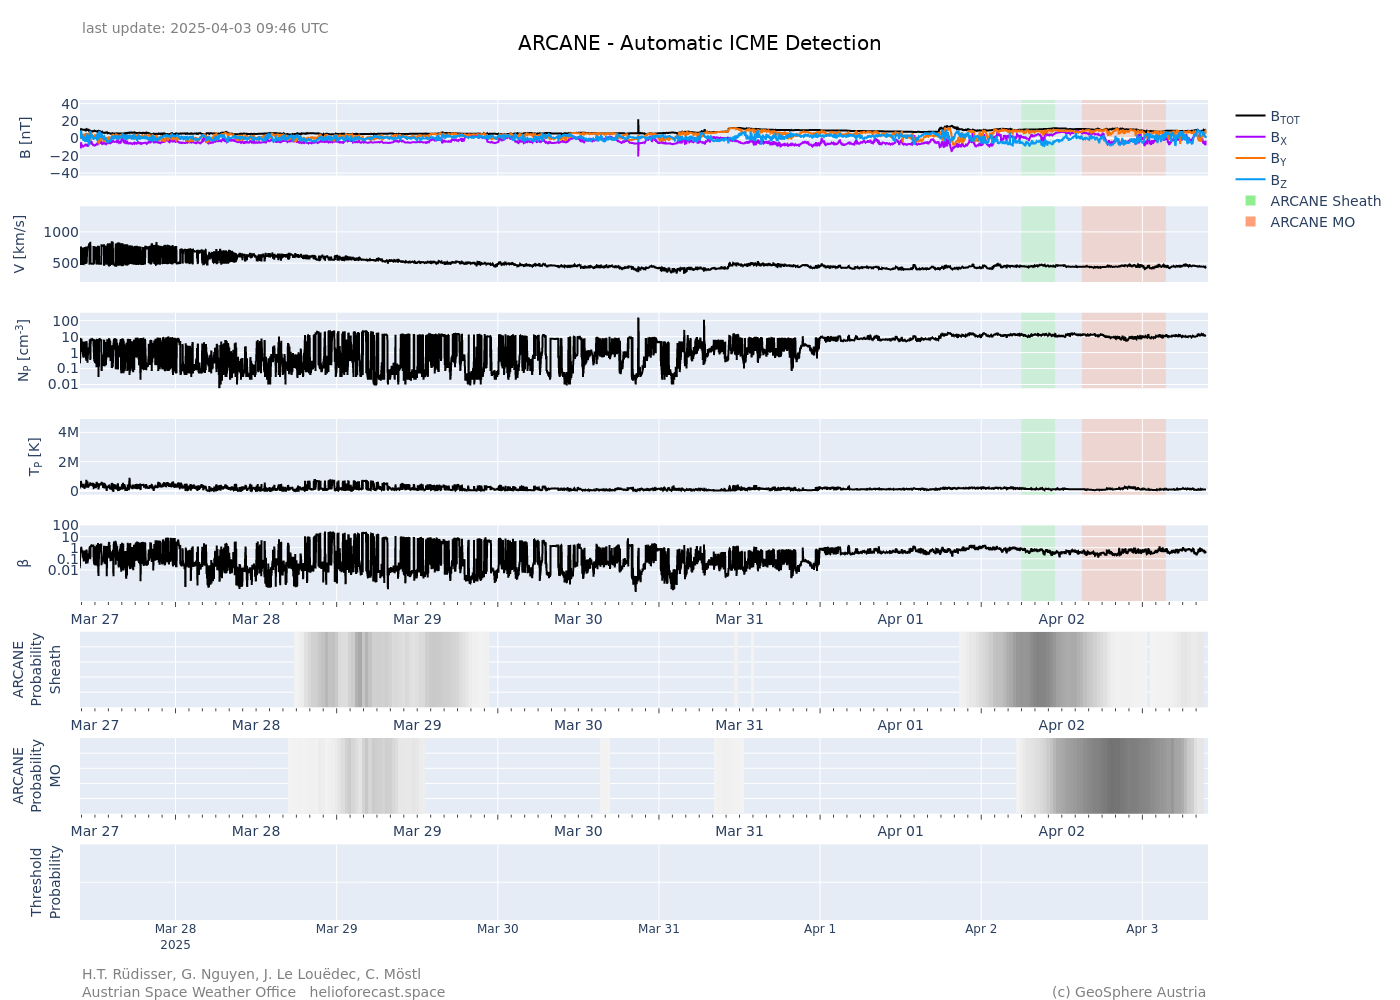
(1) ARCANE (Automatic Realtime deteCtion ANd forEcast of Interplanetary Coronal Mass Ejections) is a real time ICME detection tool based on machine learning. Here are the results of a prototype running on the NOAA real time solar wind data. (csv)
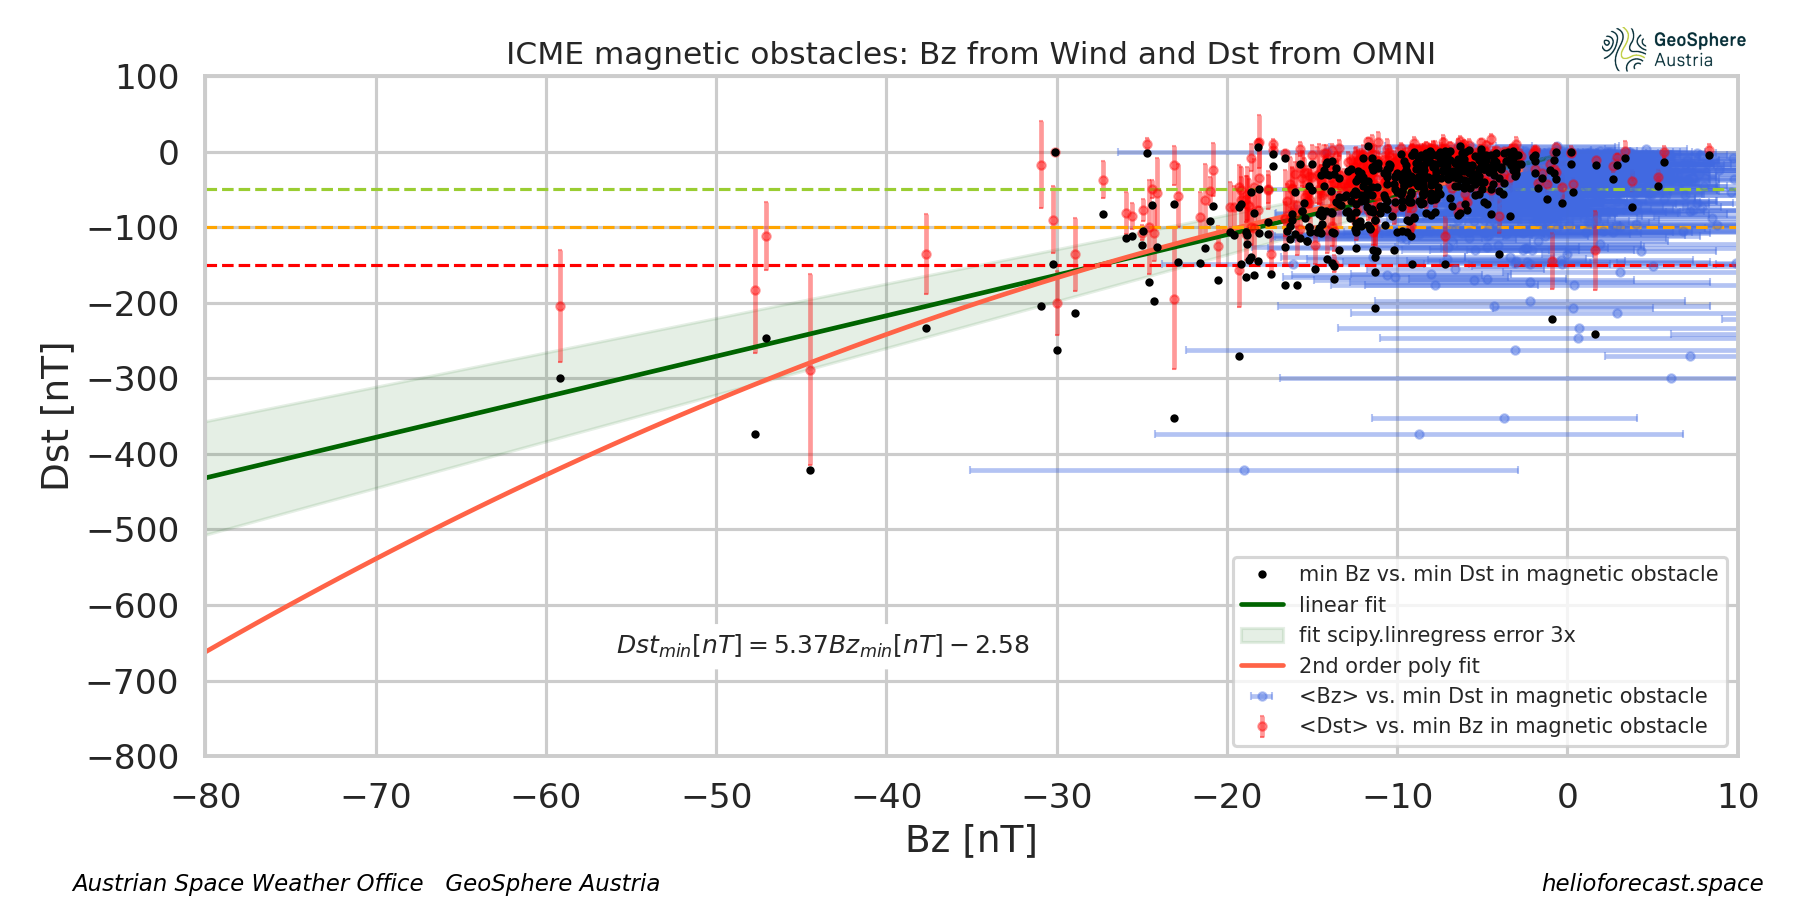
(2) This plot shows the minimum Bz in magnetic obstacles in ICMEs, observed at Wind since 1995, versus the Dst minimum during the magnetic obstacle. This is based on Dst data provided by NSSDC in the OMNI solar wind dataset and our own ICME catalog.
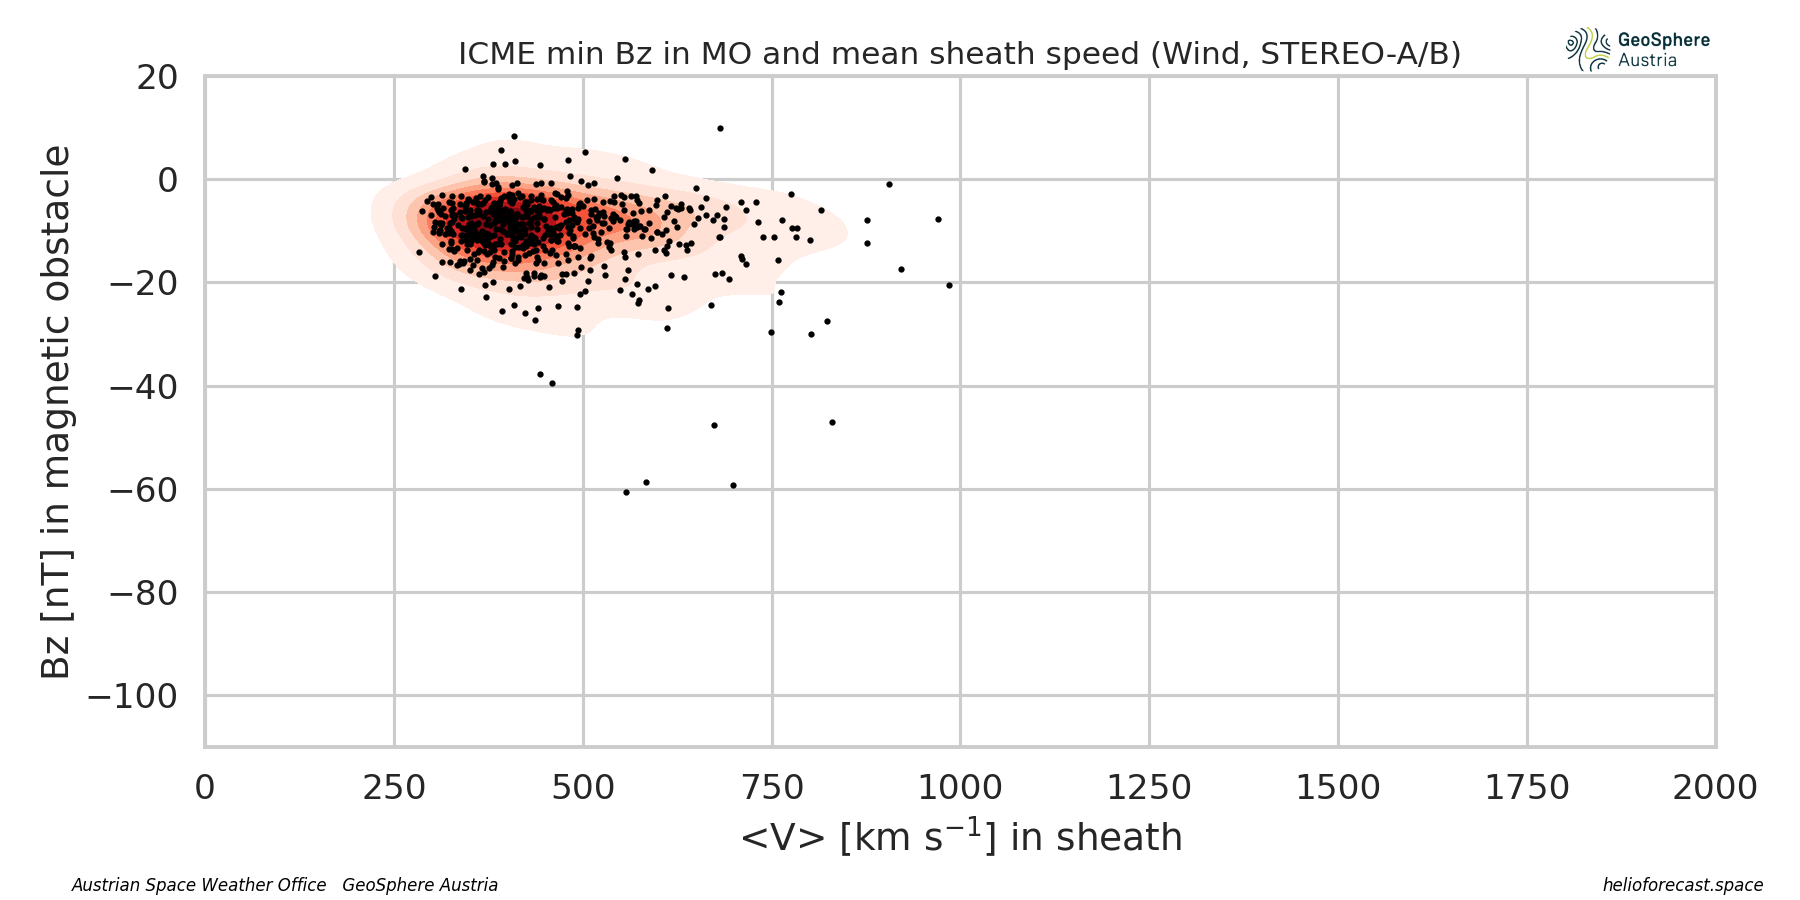
(3) Here we show the mean ICME sheath speed versus the minimum Bz in magnetic obstacles. The arrival speed can relatively well forecasted with CME propagation models. This is derived from our ICME catalog.
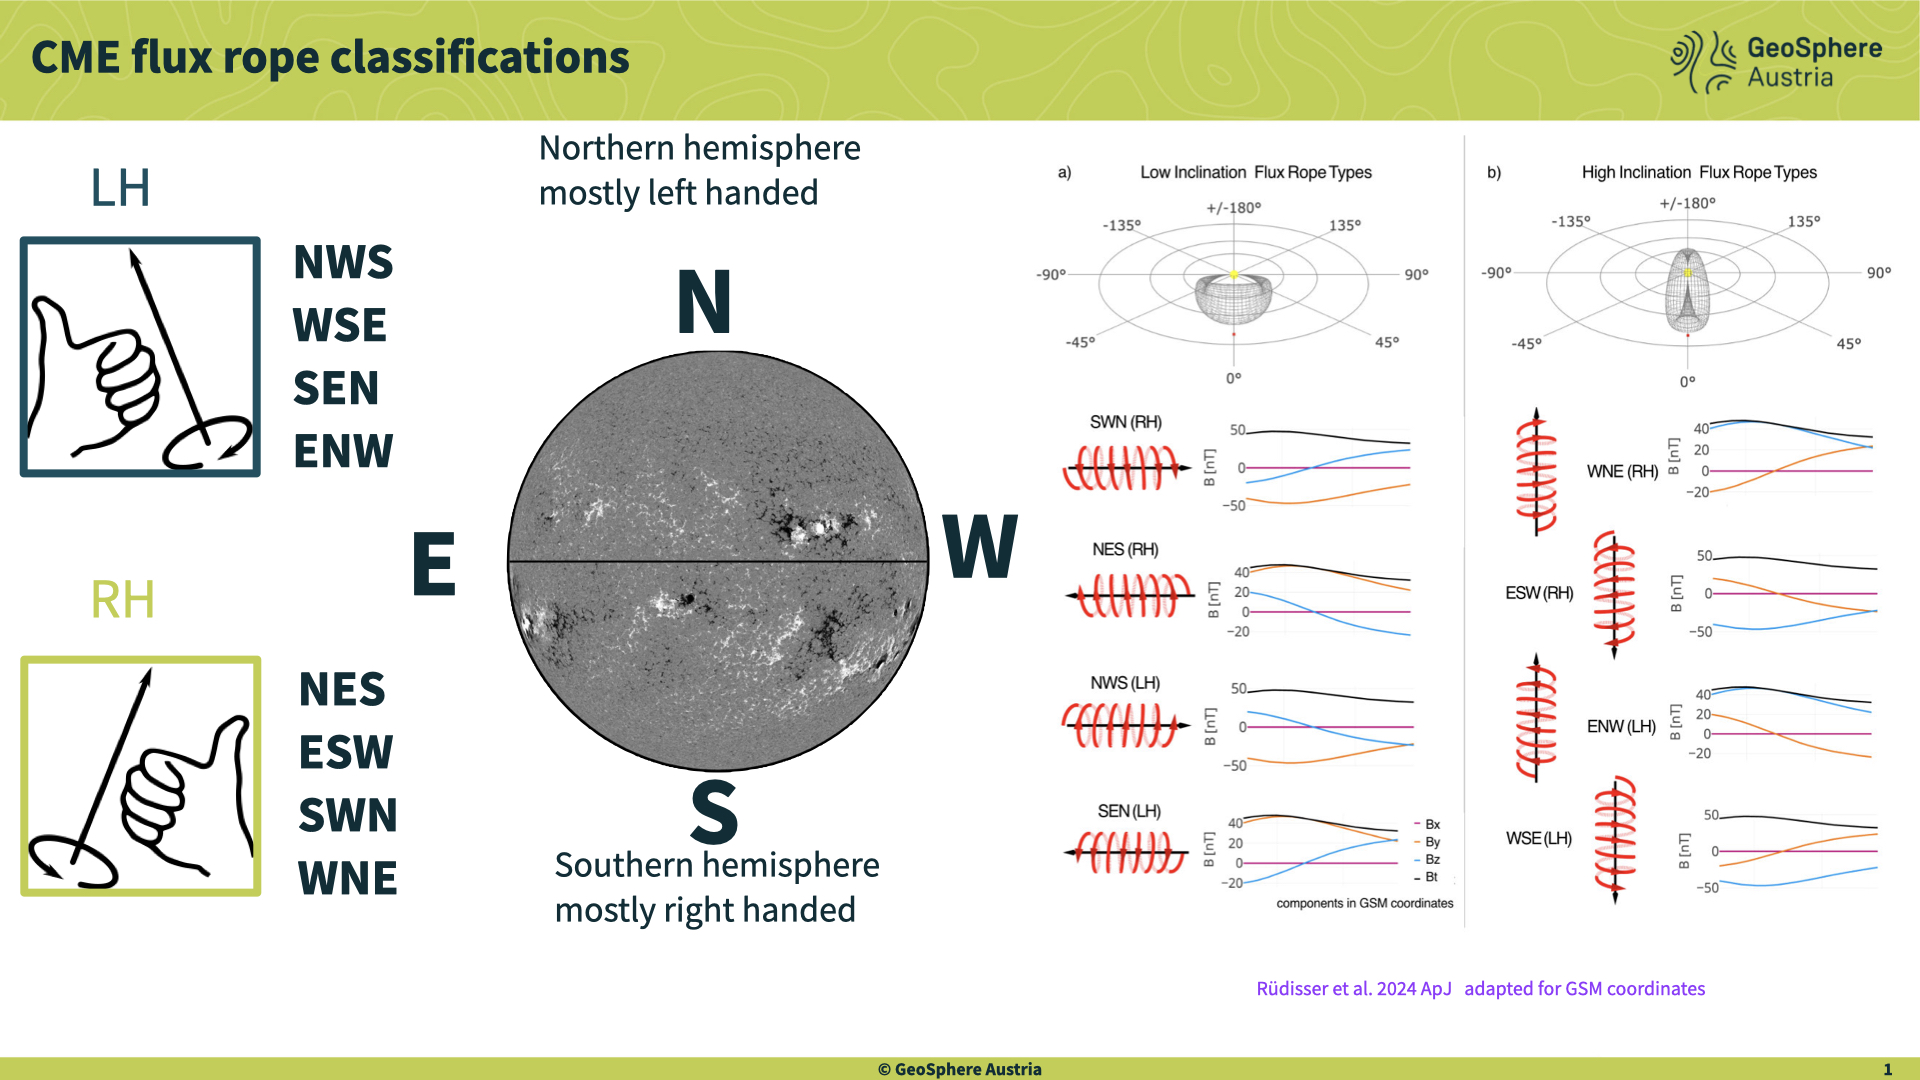
(4) This is a chart for identifying the ICME flux rope type in solar wind in situ observations, and the solar hemispheric helicity rules. Part of it is based on Rüdisser+ 2024. The Wilcox solar observatory synoptic charts show the coronal neutral line, which correlates with the flux rope orientation at Earth (Yurchyshyn et al.). Link to most recent chart.
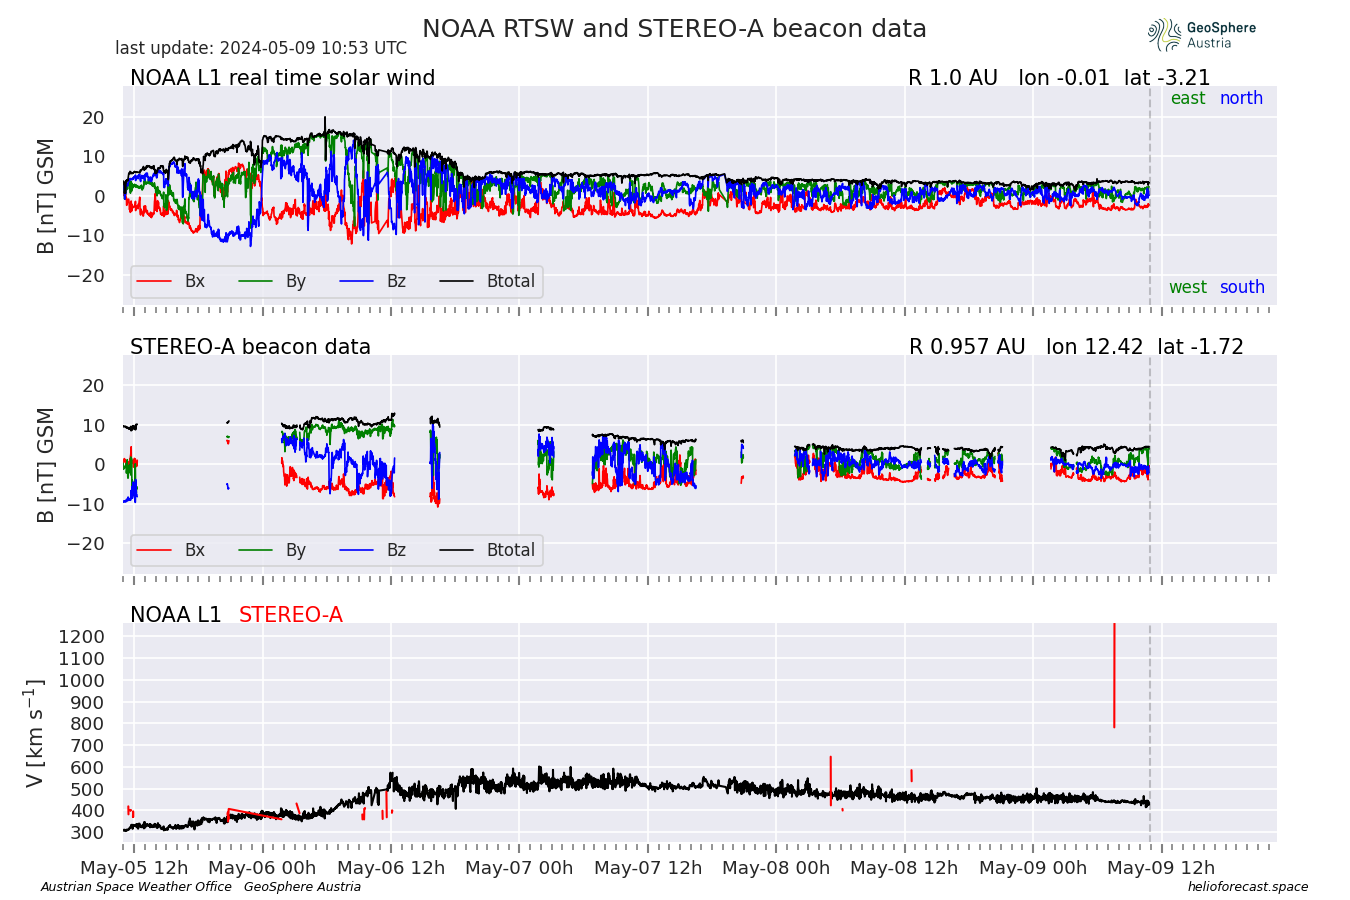
(5) These are the current real time data at L1 (from NOAA) and STEREO-A (from NASA). Click for a plotly interactive chart. Solar Orbiter MAG realtime dashboard Solar Orbiter HUXt (University of Reading) A list of papers of prototypes and websites for Bz forecasts (to be extended): Reiss+ 2021 MLBz method [paper] Riley, Reiss, Möstl 2023 which upstream conditions matter [paper] B. Jackson+ IPS method [paper] [website] Pal+ 2024 detection and forecast pipeline [paper] Nair+ 2023, MagNet—A Data-Science Competition to Predict Disturbance Storm-Time Index (Dst) From Solar Wind Data [paper]
