Aurora
This aurora visualisation is based on the solar wind data provided by NOAA at the Sun-Earth L1 point.
It runs every 10 minutes, and covers the timerange current time -12 hours to -1 hour.
The model is OVATION Prime 2010. Work on an update to OVATION Prime 2013 is underway.
The current implementation of OP10 shown here for demonstration purposes still has a few problems, so please use with caution.
There are no dedicated satellites to image the aurora, but weather satellites such as NOAA 21 / VIIRS can provide nighttime images as an approximation for a global aurora view here in the
NASA worldview system. Here is a great overview of the aurora in general by NOAA.
The gif animations below are also available as mp4:
Global
Europe
North America
We take no responsibility or liability for the frequency of provision or accuracy of our forecasts, and we will not be liable for any losses and damages in connection with using the provided information.
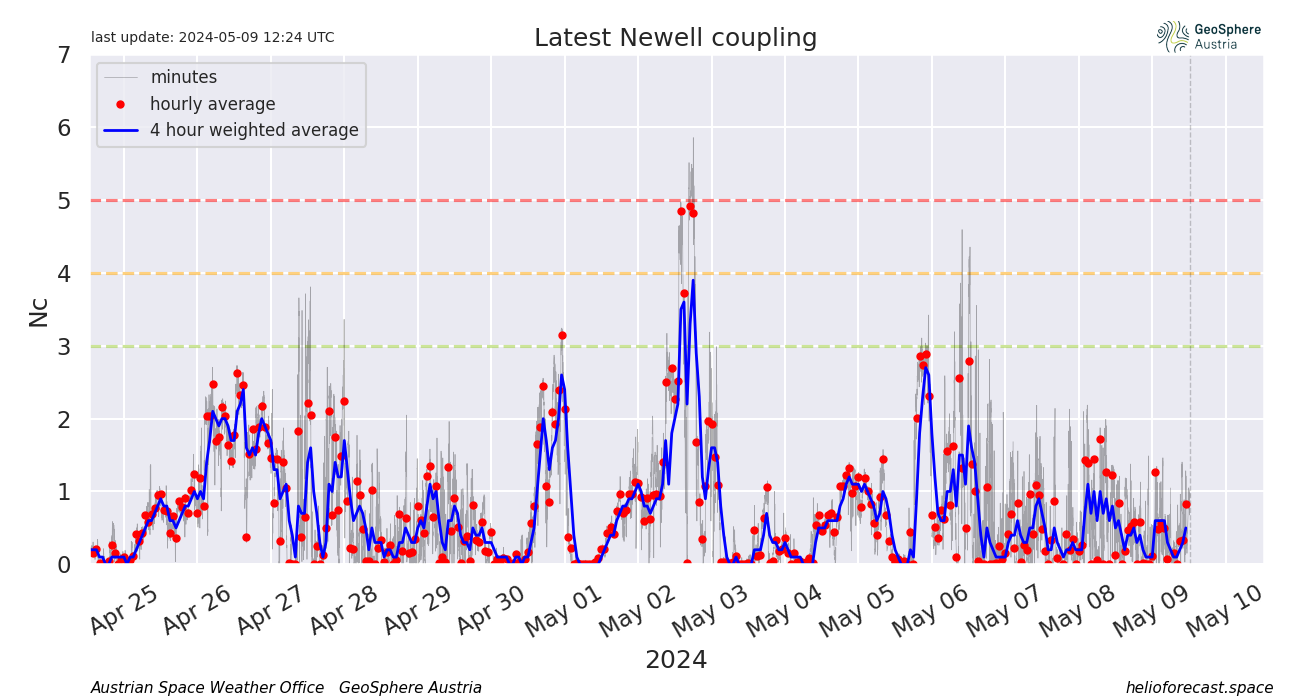
This plot describes the current Newell coupling based on the NOAA L1 real time solar wind.